A tool to help Kiwis use electricity sustainably — Part 1
Background
New Zealand National Power Grid:
The electricity from all sources flows into the national grid, meaning every consumer gets a mix of renewable and non-renewable electricity regardless of their provider.
Genesis Energy is one of New Zealand’s largest electricity providers, running the country's only coal power plant, Huntly Power Station. While 83% of New Zealand's electricity is generated from renewable sources such as hydro, geothermal, wind, and solar, the remainder comes from high-emission sources like coal, gas, and diesel.
Problem
The electricity from all sources flows into the national grid, meaning every consumer gets a mix of renewable and non-renewable electricity regardless of their provider. However, competitors of Genesis claimed they only use renewable sources, creating a misleading impression that choosing them ensures “Clean power”.
Genesis sought to dispel this myth and provide tools for customers to make more sustainable energy choices.
🎯 Objective
Educate New Zealanders about the realities of electricity generation and empower them to make sustainable energy decisions by creating a tool that:- Debunked myths around renewable-only electricity providers.
- Encouraged consumers to reduce energy use during high-carbon emission periods.
- Helped the company lead sustainability efforts in the energy sector.
Discovery
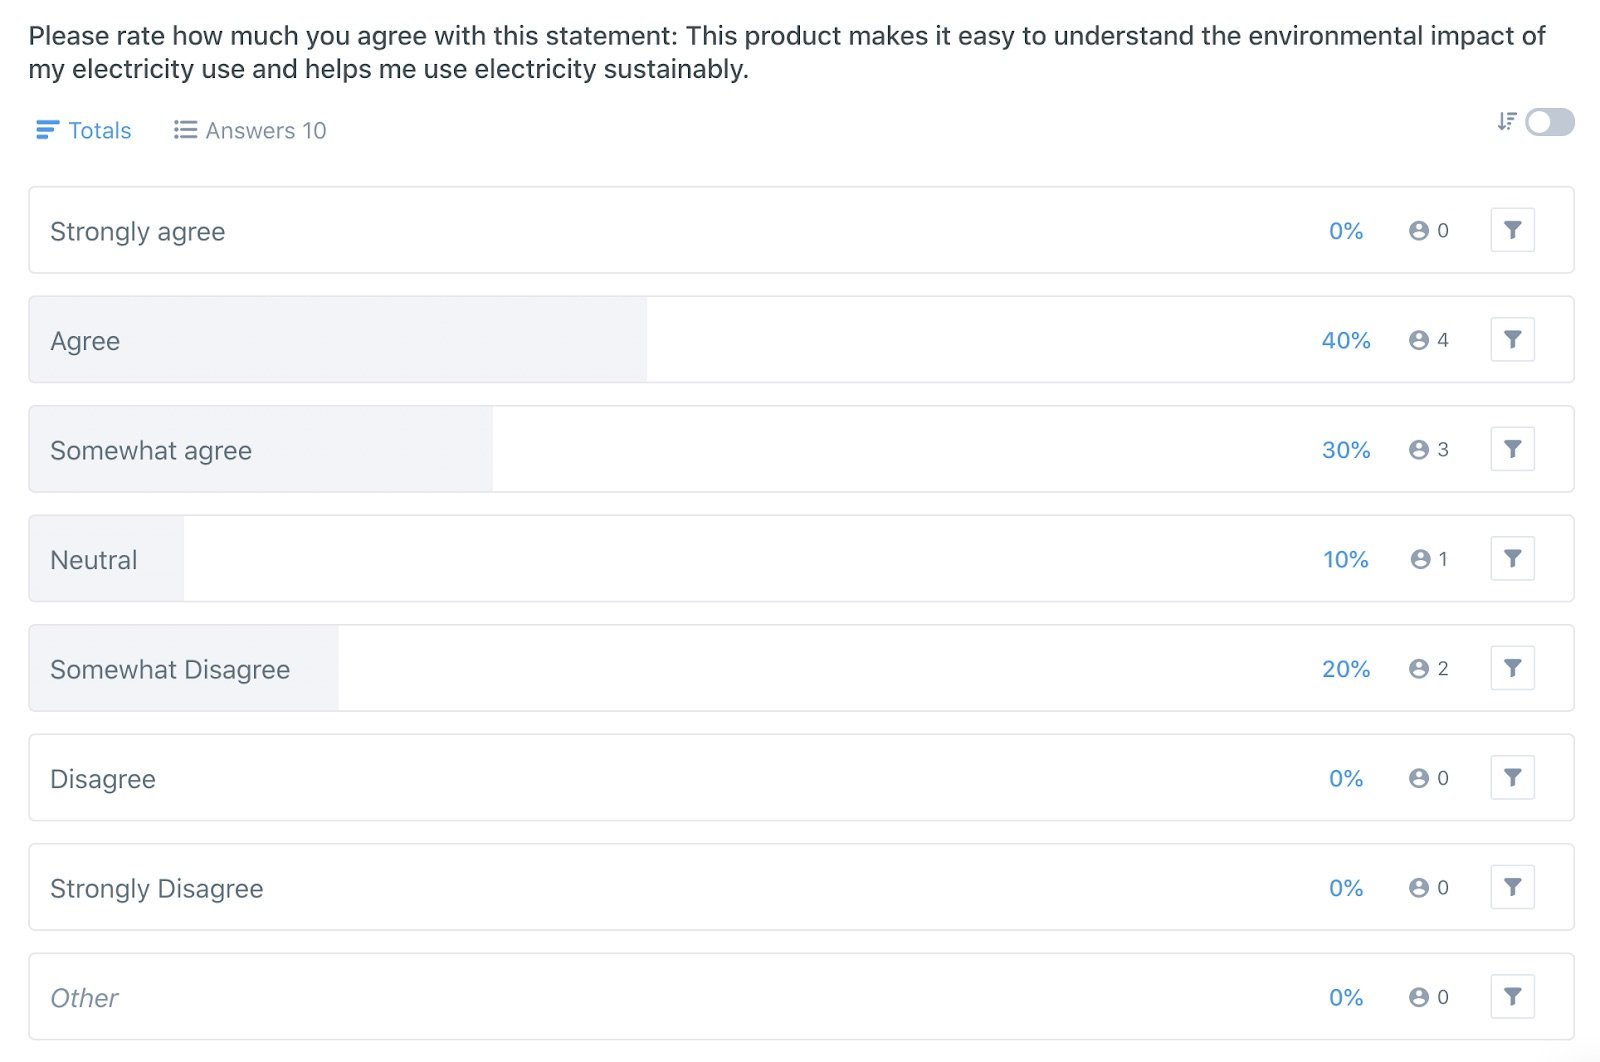
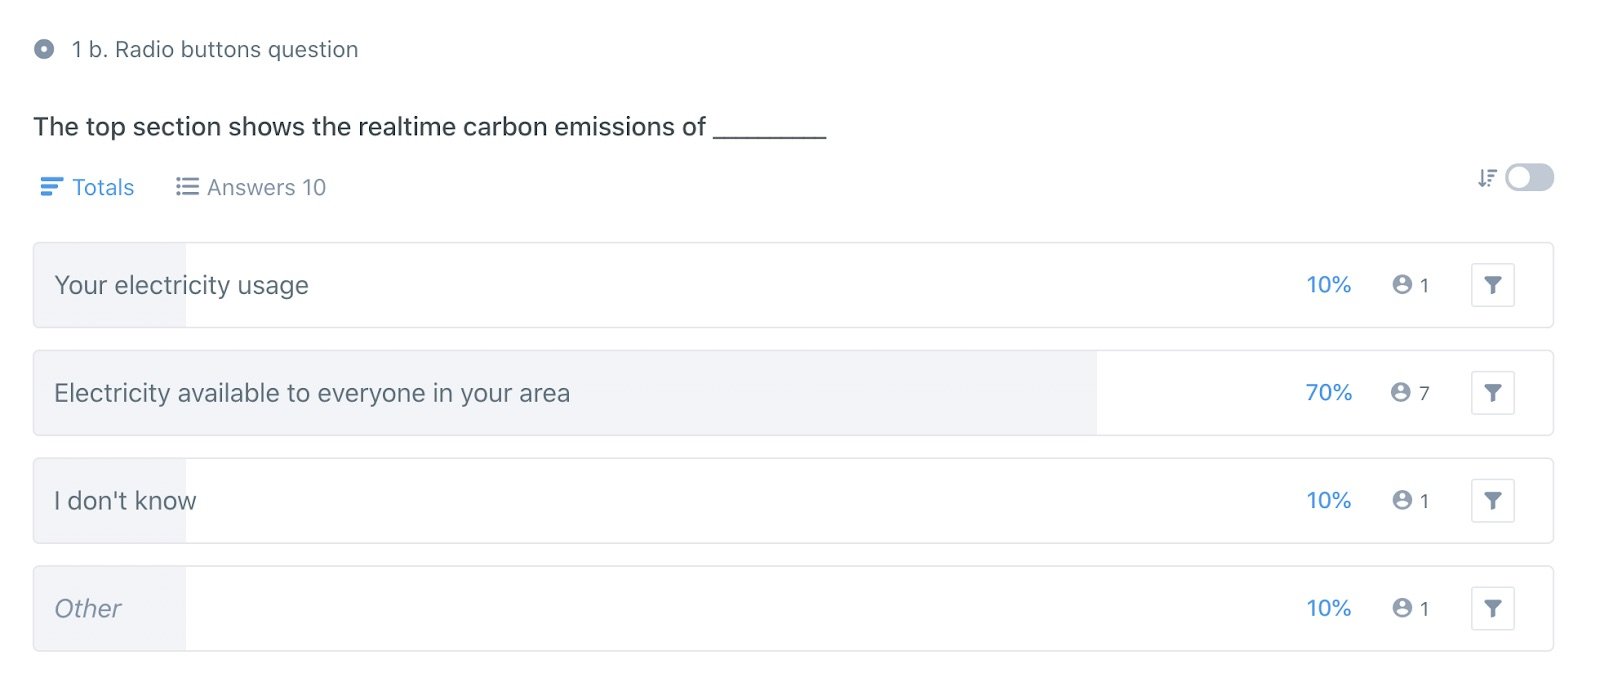
We conducted a survey among our customer panel which include both genesis and non-genesis customers about what they know about this problem.
One of the questions from the survey. The participants included were Genesis and non-genesis customers
💡 Key Findings
- Most New Zealand consumers are unaware of the carbon emissions associated with electricity use. Many believe electricity is inherently clean.
- The growing adoption of electric vehicles is increasing demand, which is increasing reliance on high-carbon energy sources.
- Consumers lack an understanding of how the national grid operates. Misconceptions persist, fueled by myths from some power companies about the need for specific providers to access renewable energy.
- 60% of surveyed consumers were unaware that their electricity is a mix of renewable and non-renewable sources.
- Once informed, consumers showed a strong interest in learning how to use electricity more sustainably to reduce their environmental impact.
- Participants showed a strong desire for such a tool, appreciating its potential to address these knowledge gap.
With a better clarity on what needs to be done, we decided to build an MVP tool get it into customers’s hand to see what they think and how it would influence their behaviour.
Ideation workshop
With a clear idea of problem and business value, our team did a workshop to figure out what we can build and what kind of data we need.
I facilitated an ideation workshop with product and engineering teams
From the workshop, we came up with a wireframe, which:
Educate customers about carbon emission from electricity.
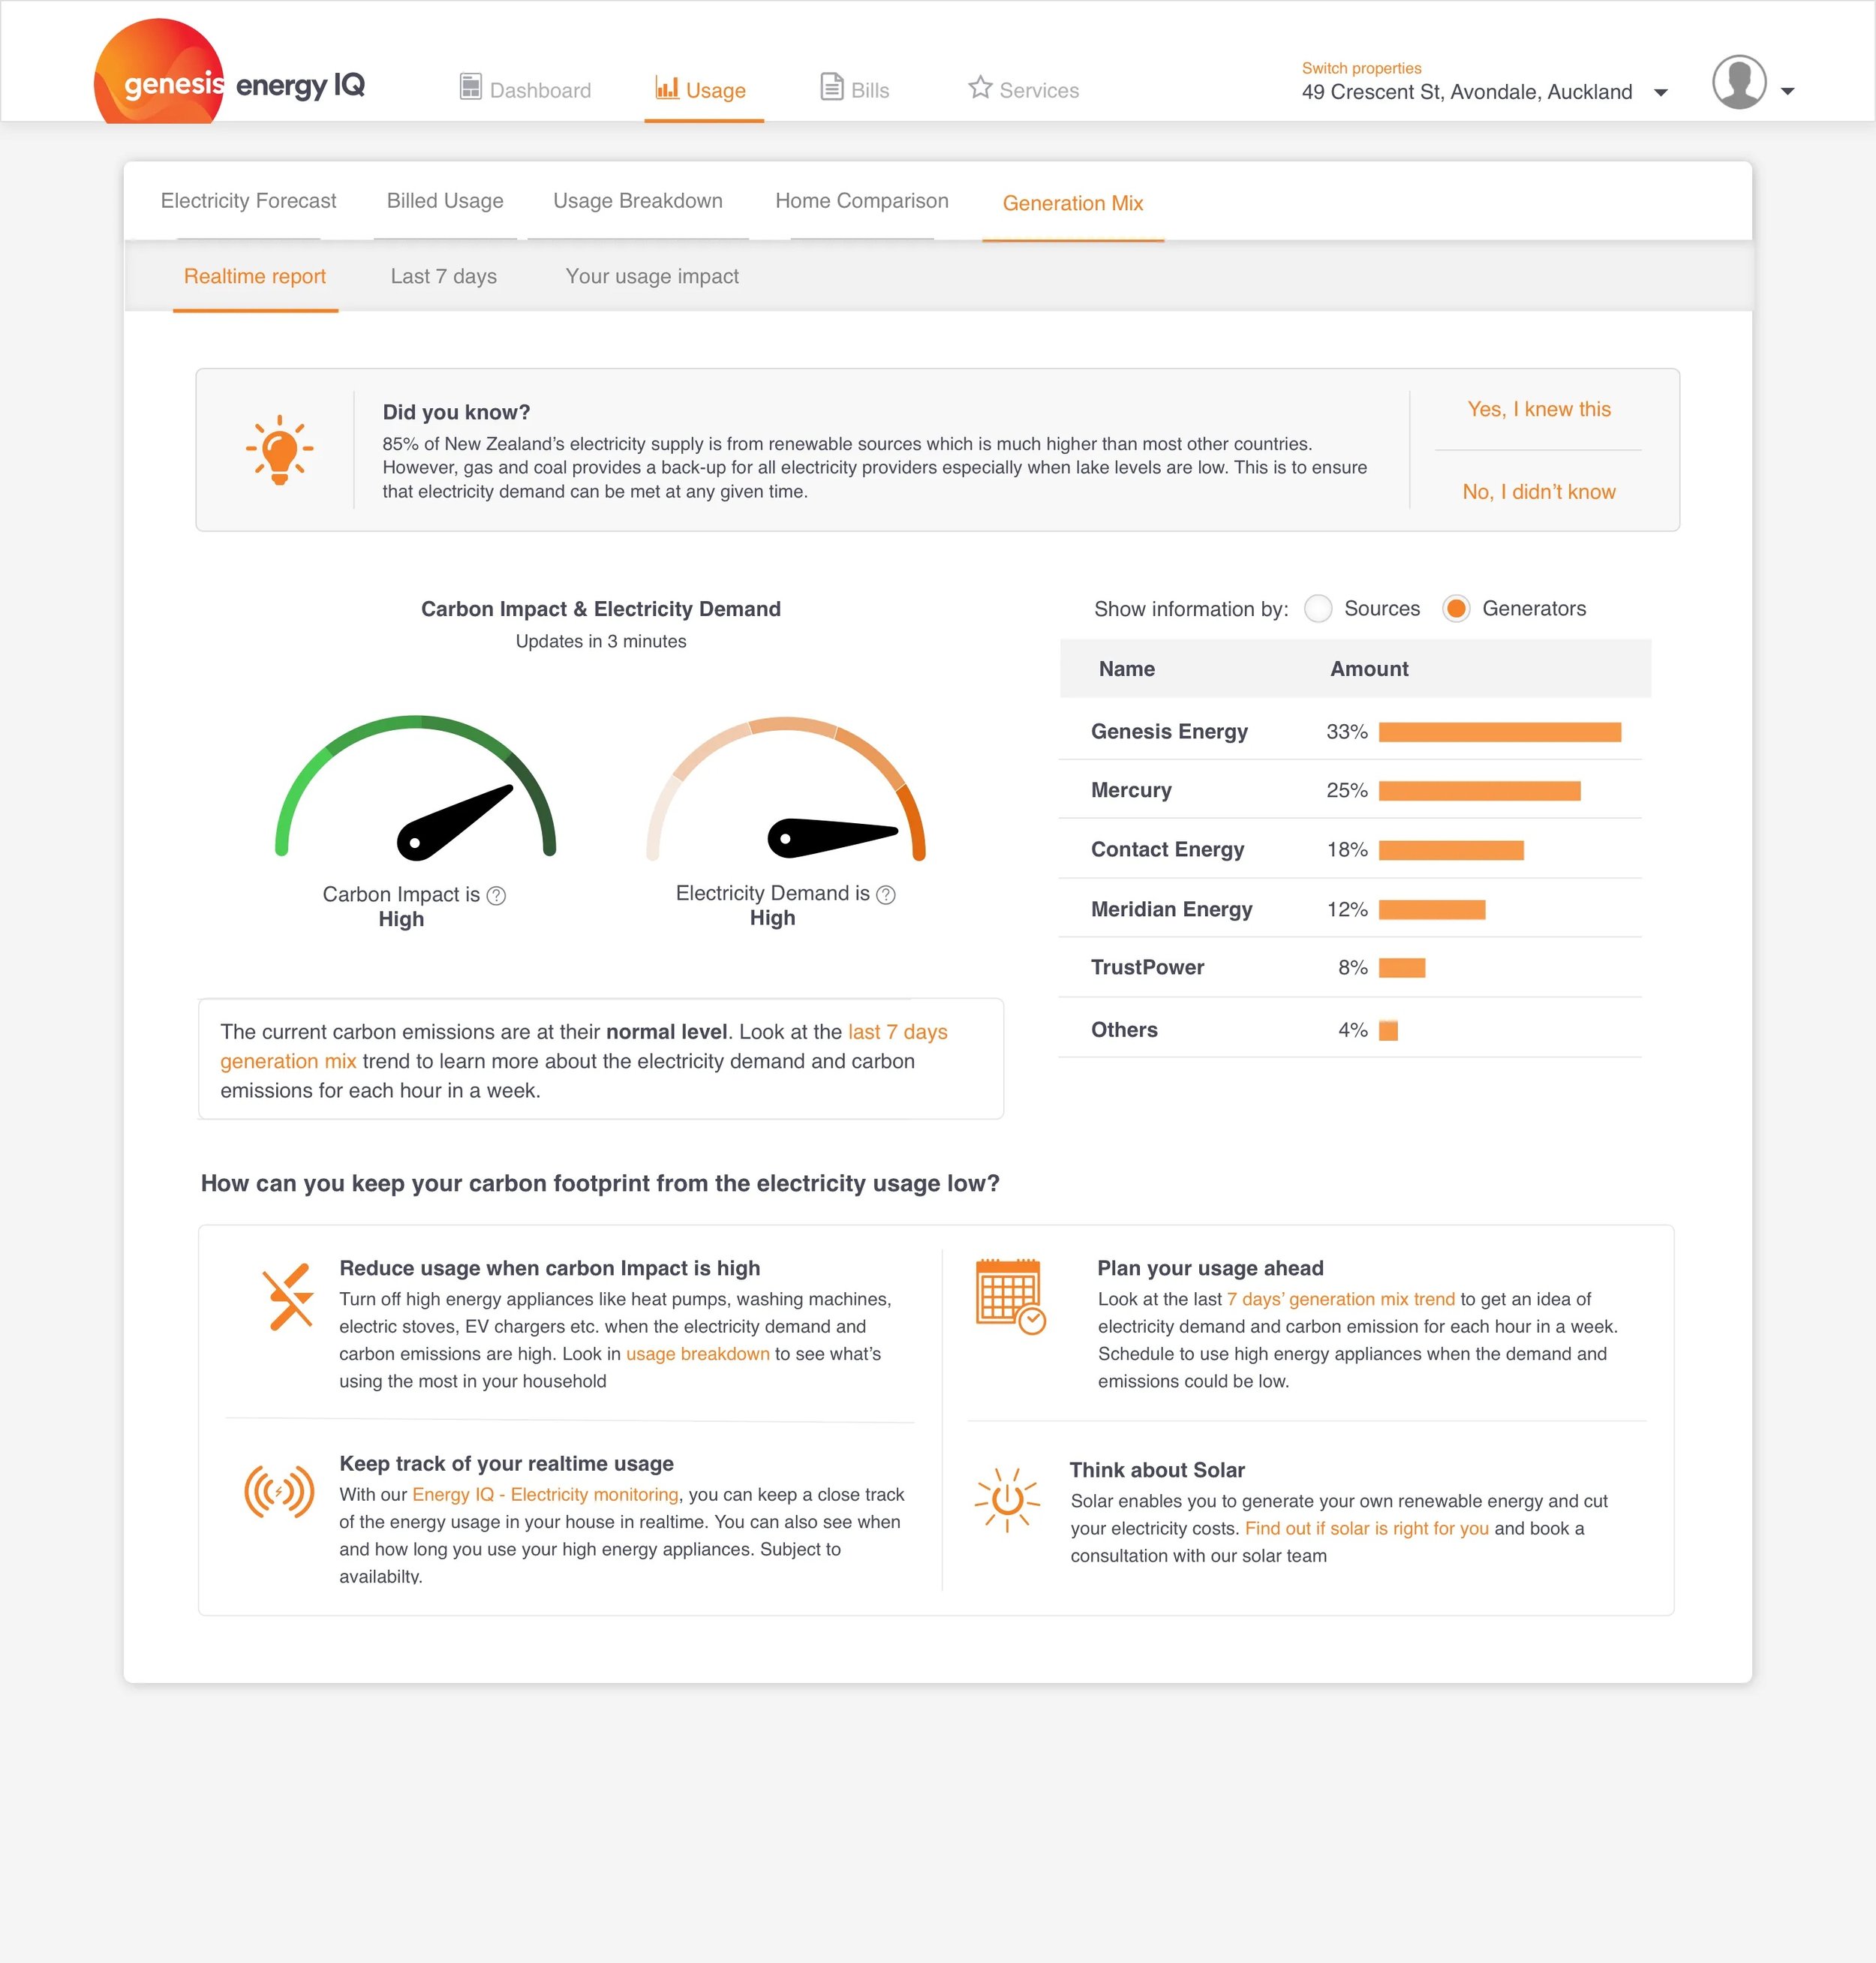
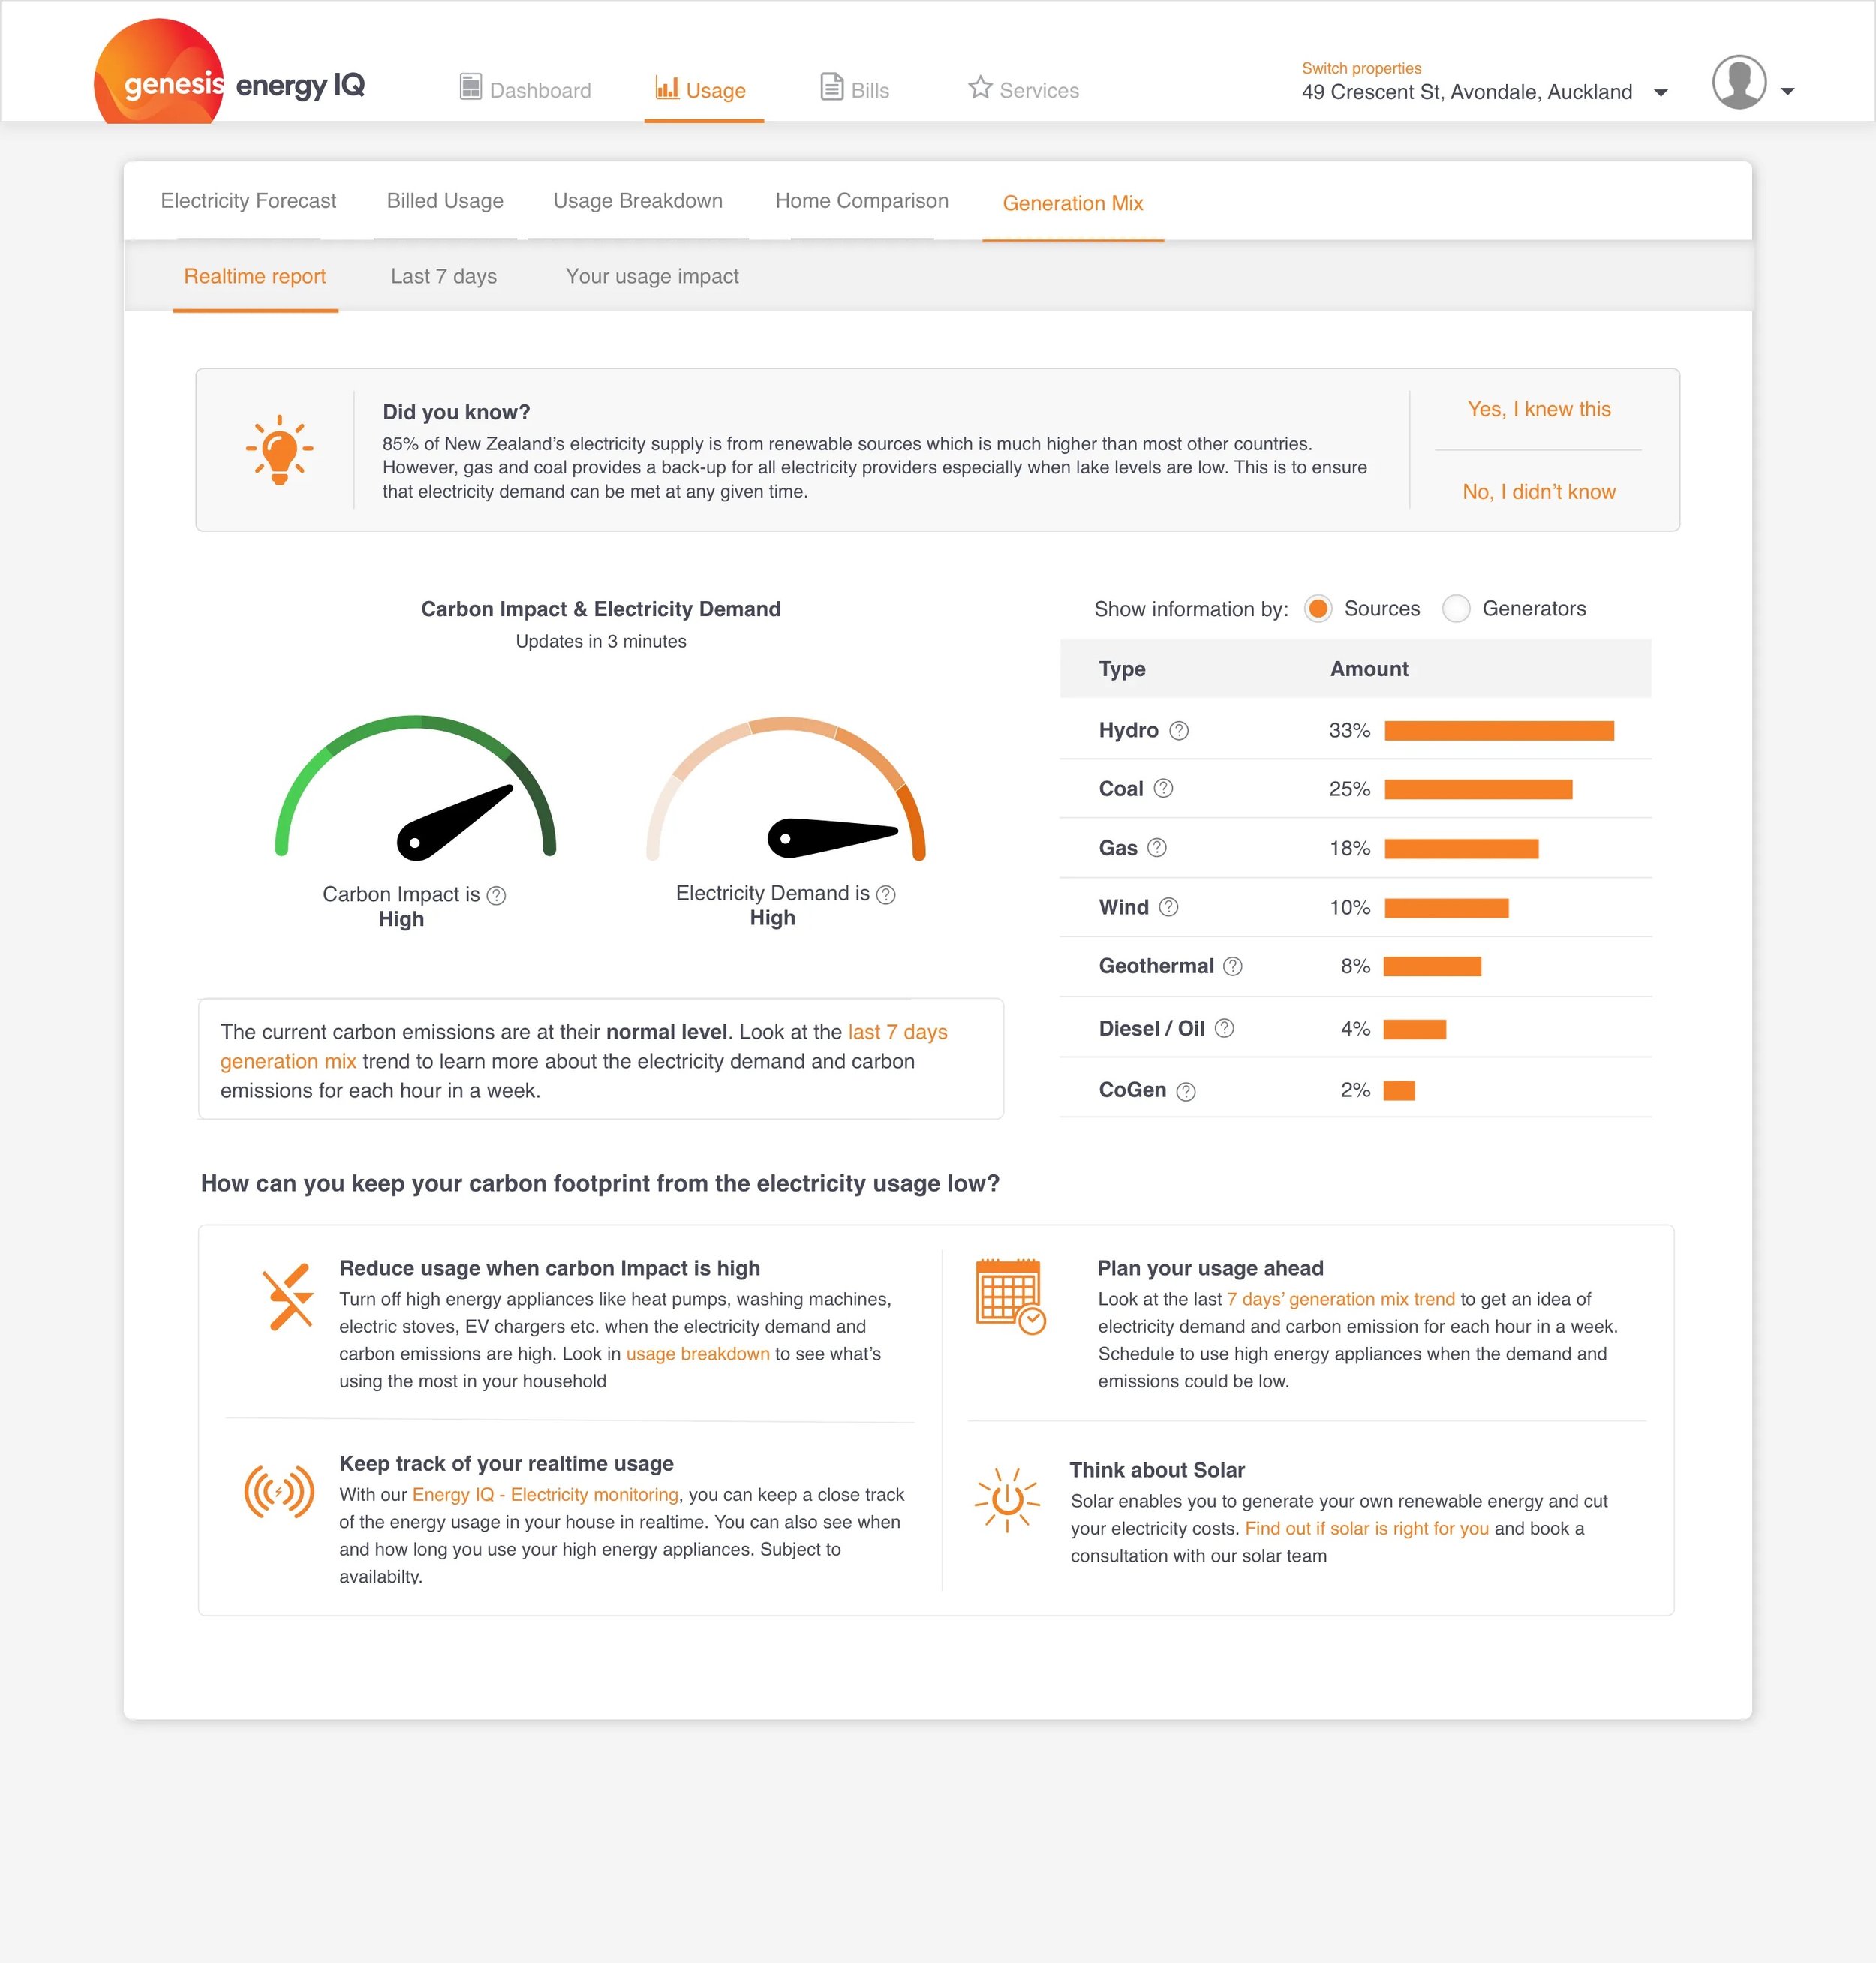
Educate everybody in New Zealand gets electricity generated from all sources and all generators.
Show what’s the carbon impact of the electricity available in realtime.
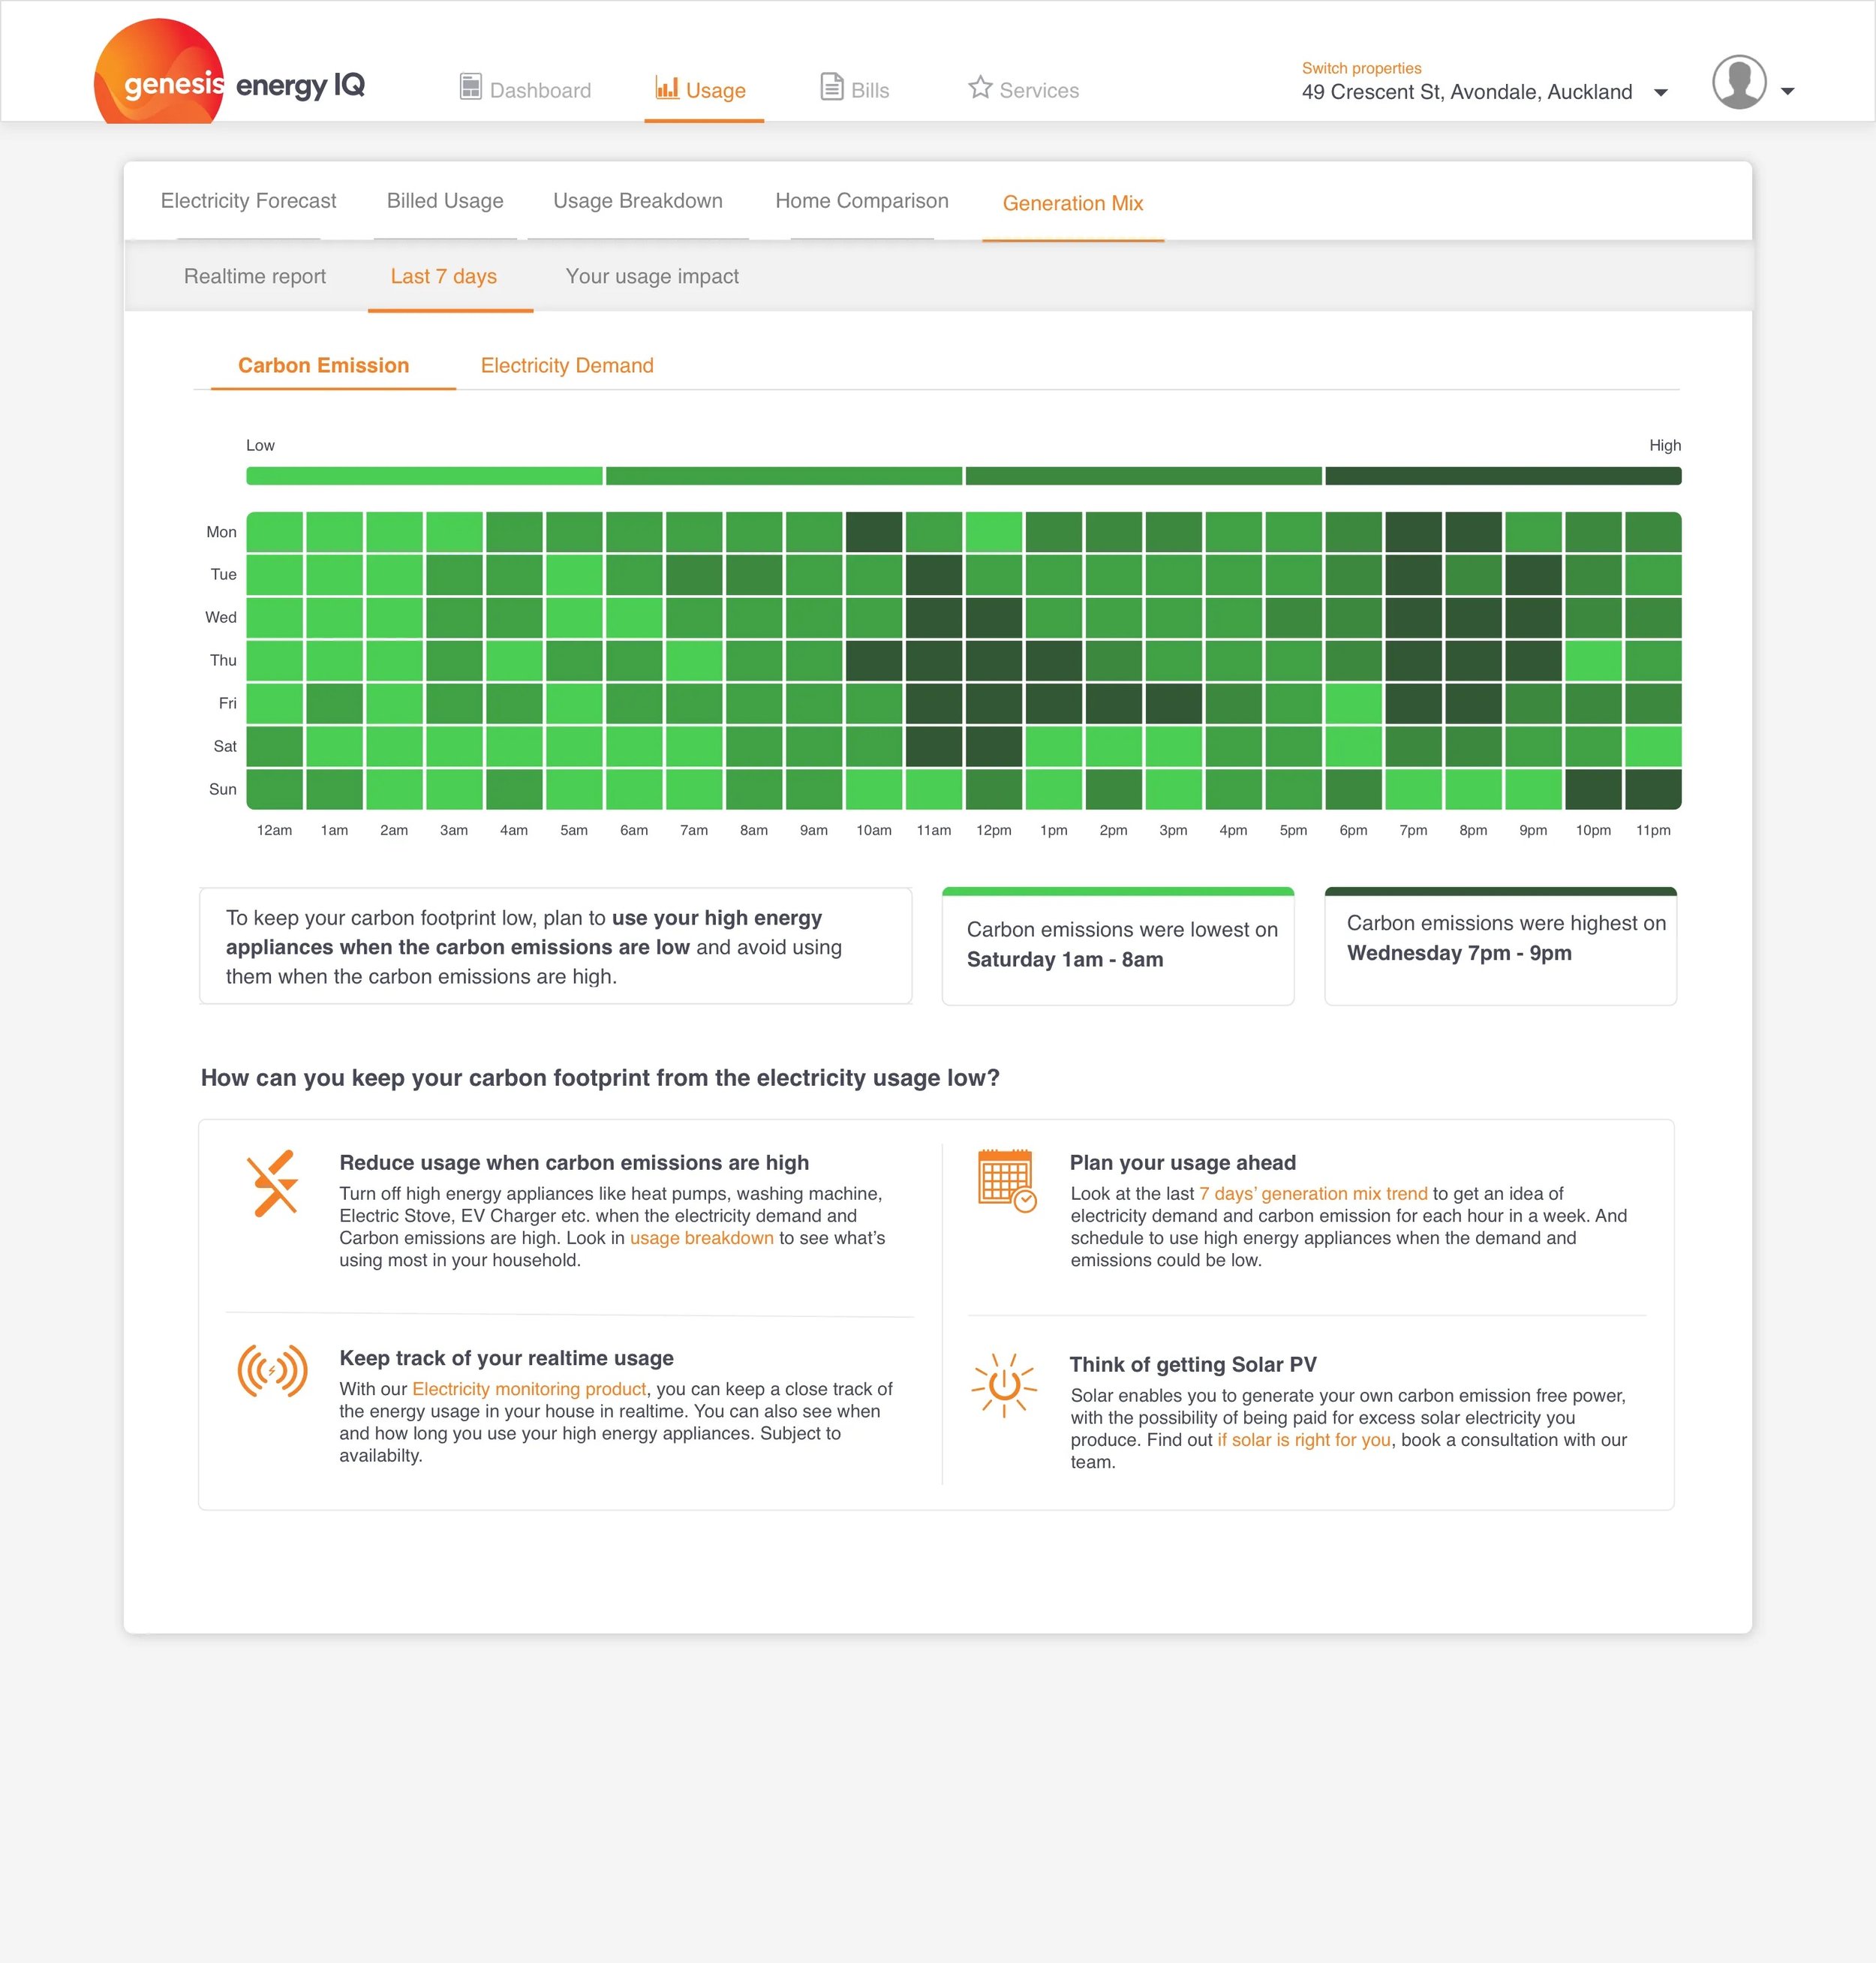
Show the trend of carbon emission so that they can plan to reduce their usage during high carbon times and increase during low carbon times.
Show the carbon impact from electricity consumption of an individual house — which would encourage them to plan their usage ahead.
After the workshop, I turned the sketches into a clickable prototype to test with the users and get feedback. Meanwhile, the engineers started laying engineering infrastructure for the tool.
Rapid iteration
Since this was a first-of-its-kind tool, I knew it would take several iterations to get it right. Face-to-face interviews felt too expensive and time-consuming, so I decided to conduct remote click and comprehension tests using UsabilityHub instead.
I broke the feature into smaller parts based on user goals and tested each one. For each test, I assigned tasks and asked open-ended to gauge:
• What was their first impression?
• How much did they understand what it shows and how to interact with it?
• Is this the correct UI pattern to effectively communicate what’s required, and why?
After gathering feedback, I tagged responses to quantify how many users understood the feature and where they struggled. I also asked about their overall impression of the tool.
This process was repeated across six iterations, allowing me to refine the design with each round until it was ready.
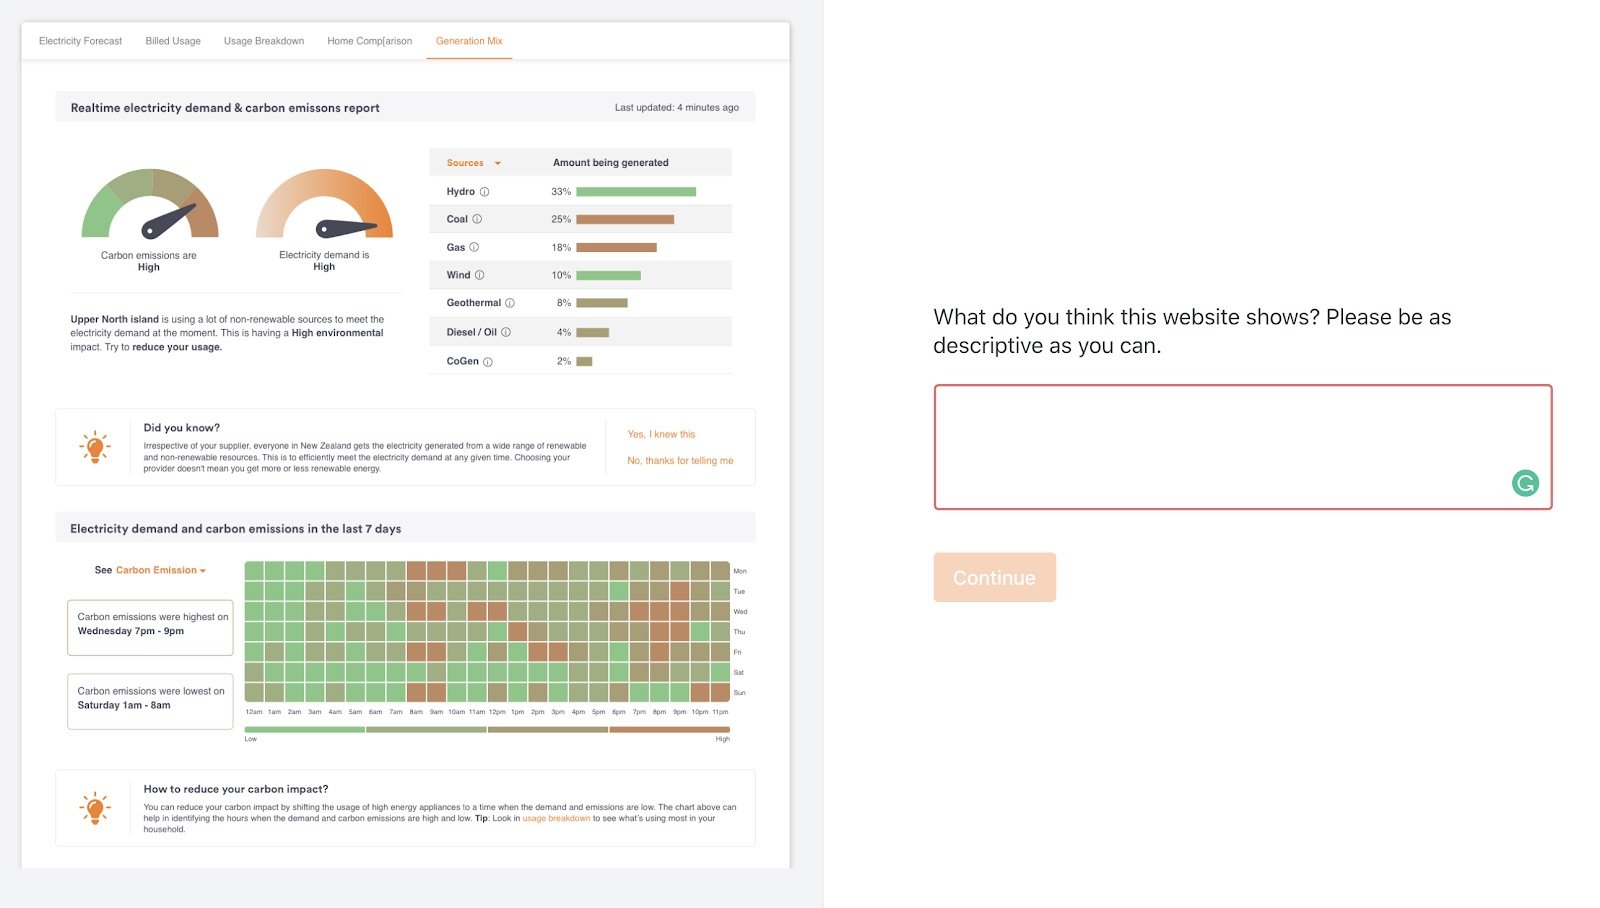
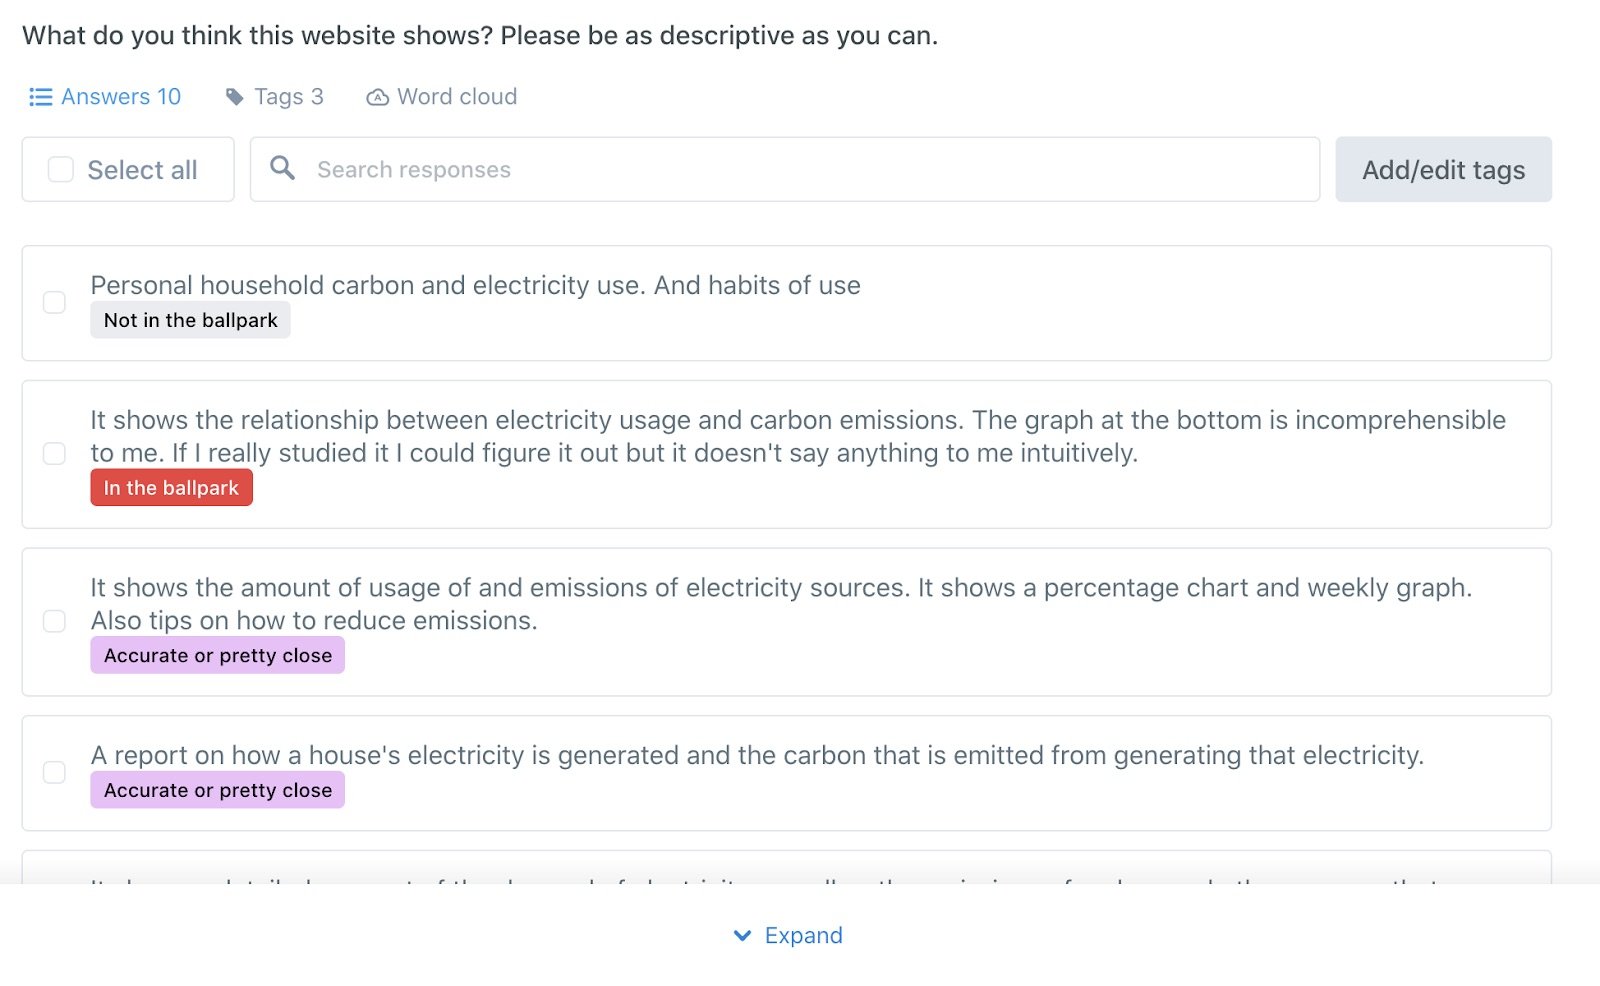


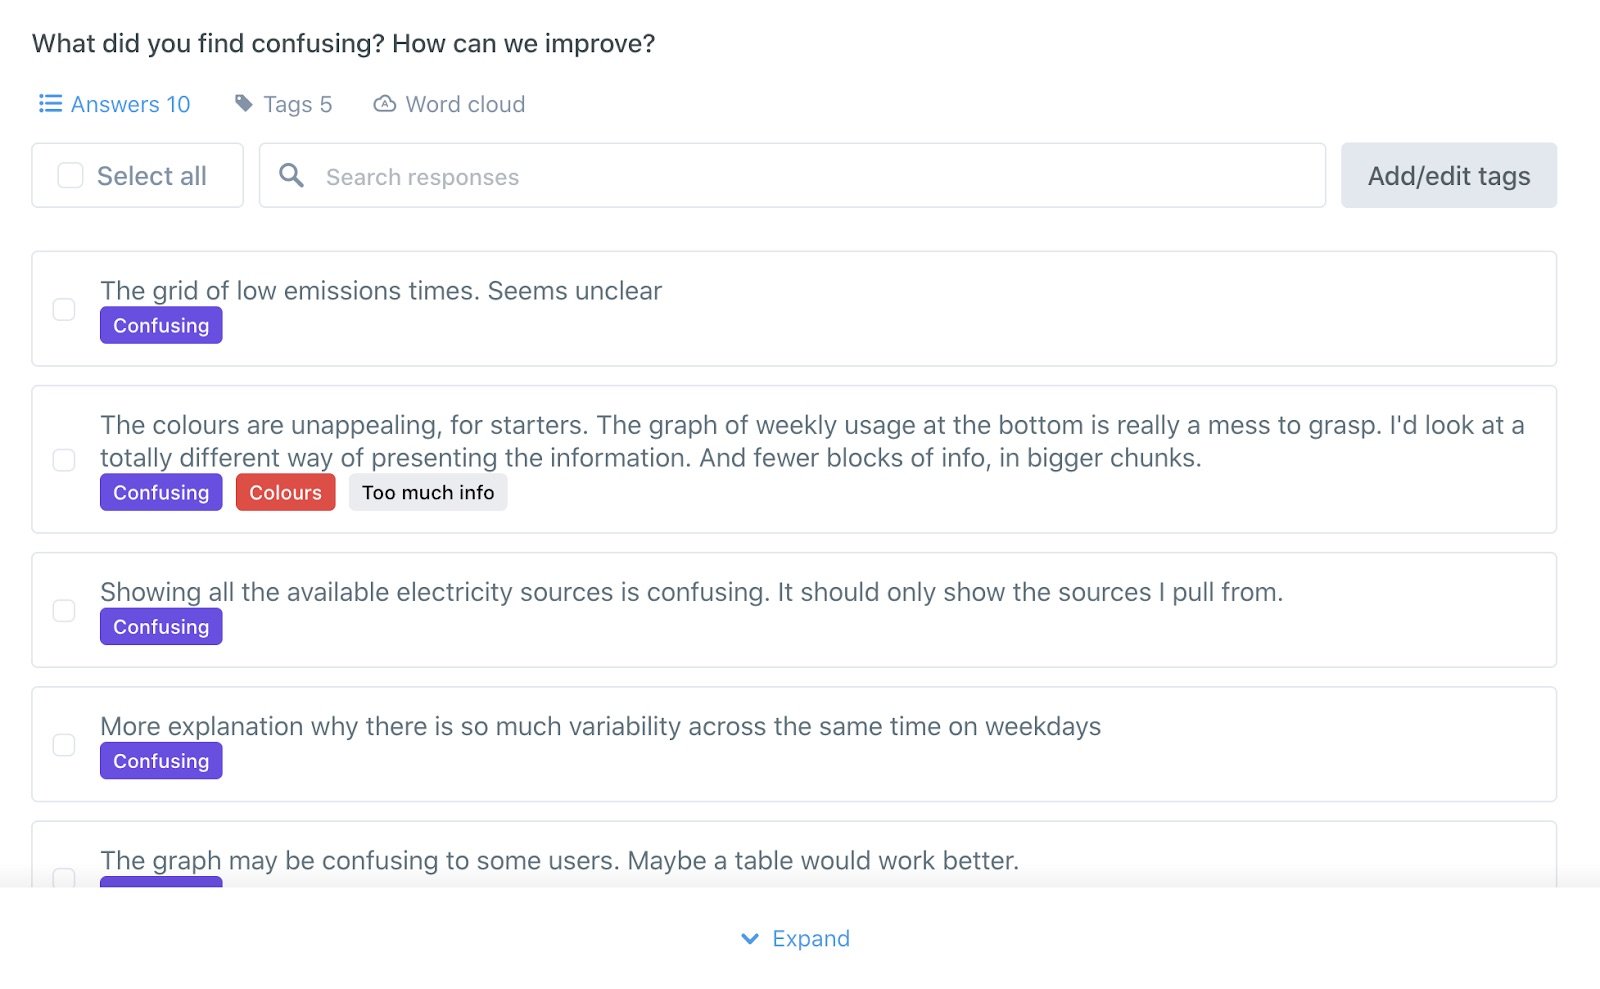
Detailed reports:
https://app.usabilityhub.com/tests/443de112e67c/results/cb1152d39b89
https://app.usabilityhub.com/tests/f290efc1ee8a/results/3a130cc7cbeb
https://app.usabilityhub.com/tests/6ce932da1605/results/b032b067a8d0
Solution
Once we were confident about the design, I did the detailed design ready to be developed.
The development took a couple of sprints. Marketing found a name for the feature – Eco Tracker. Once the development was completed, we slowly rolled it out to small batches of users using Google Optimize, closely monitoring the user activity.
The final version looked like this:
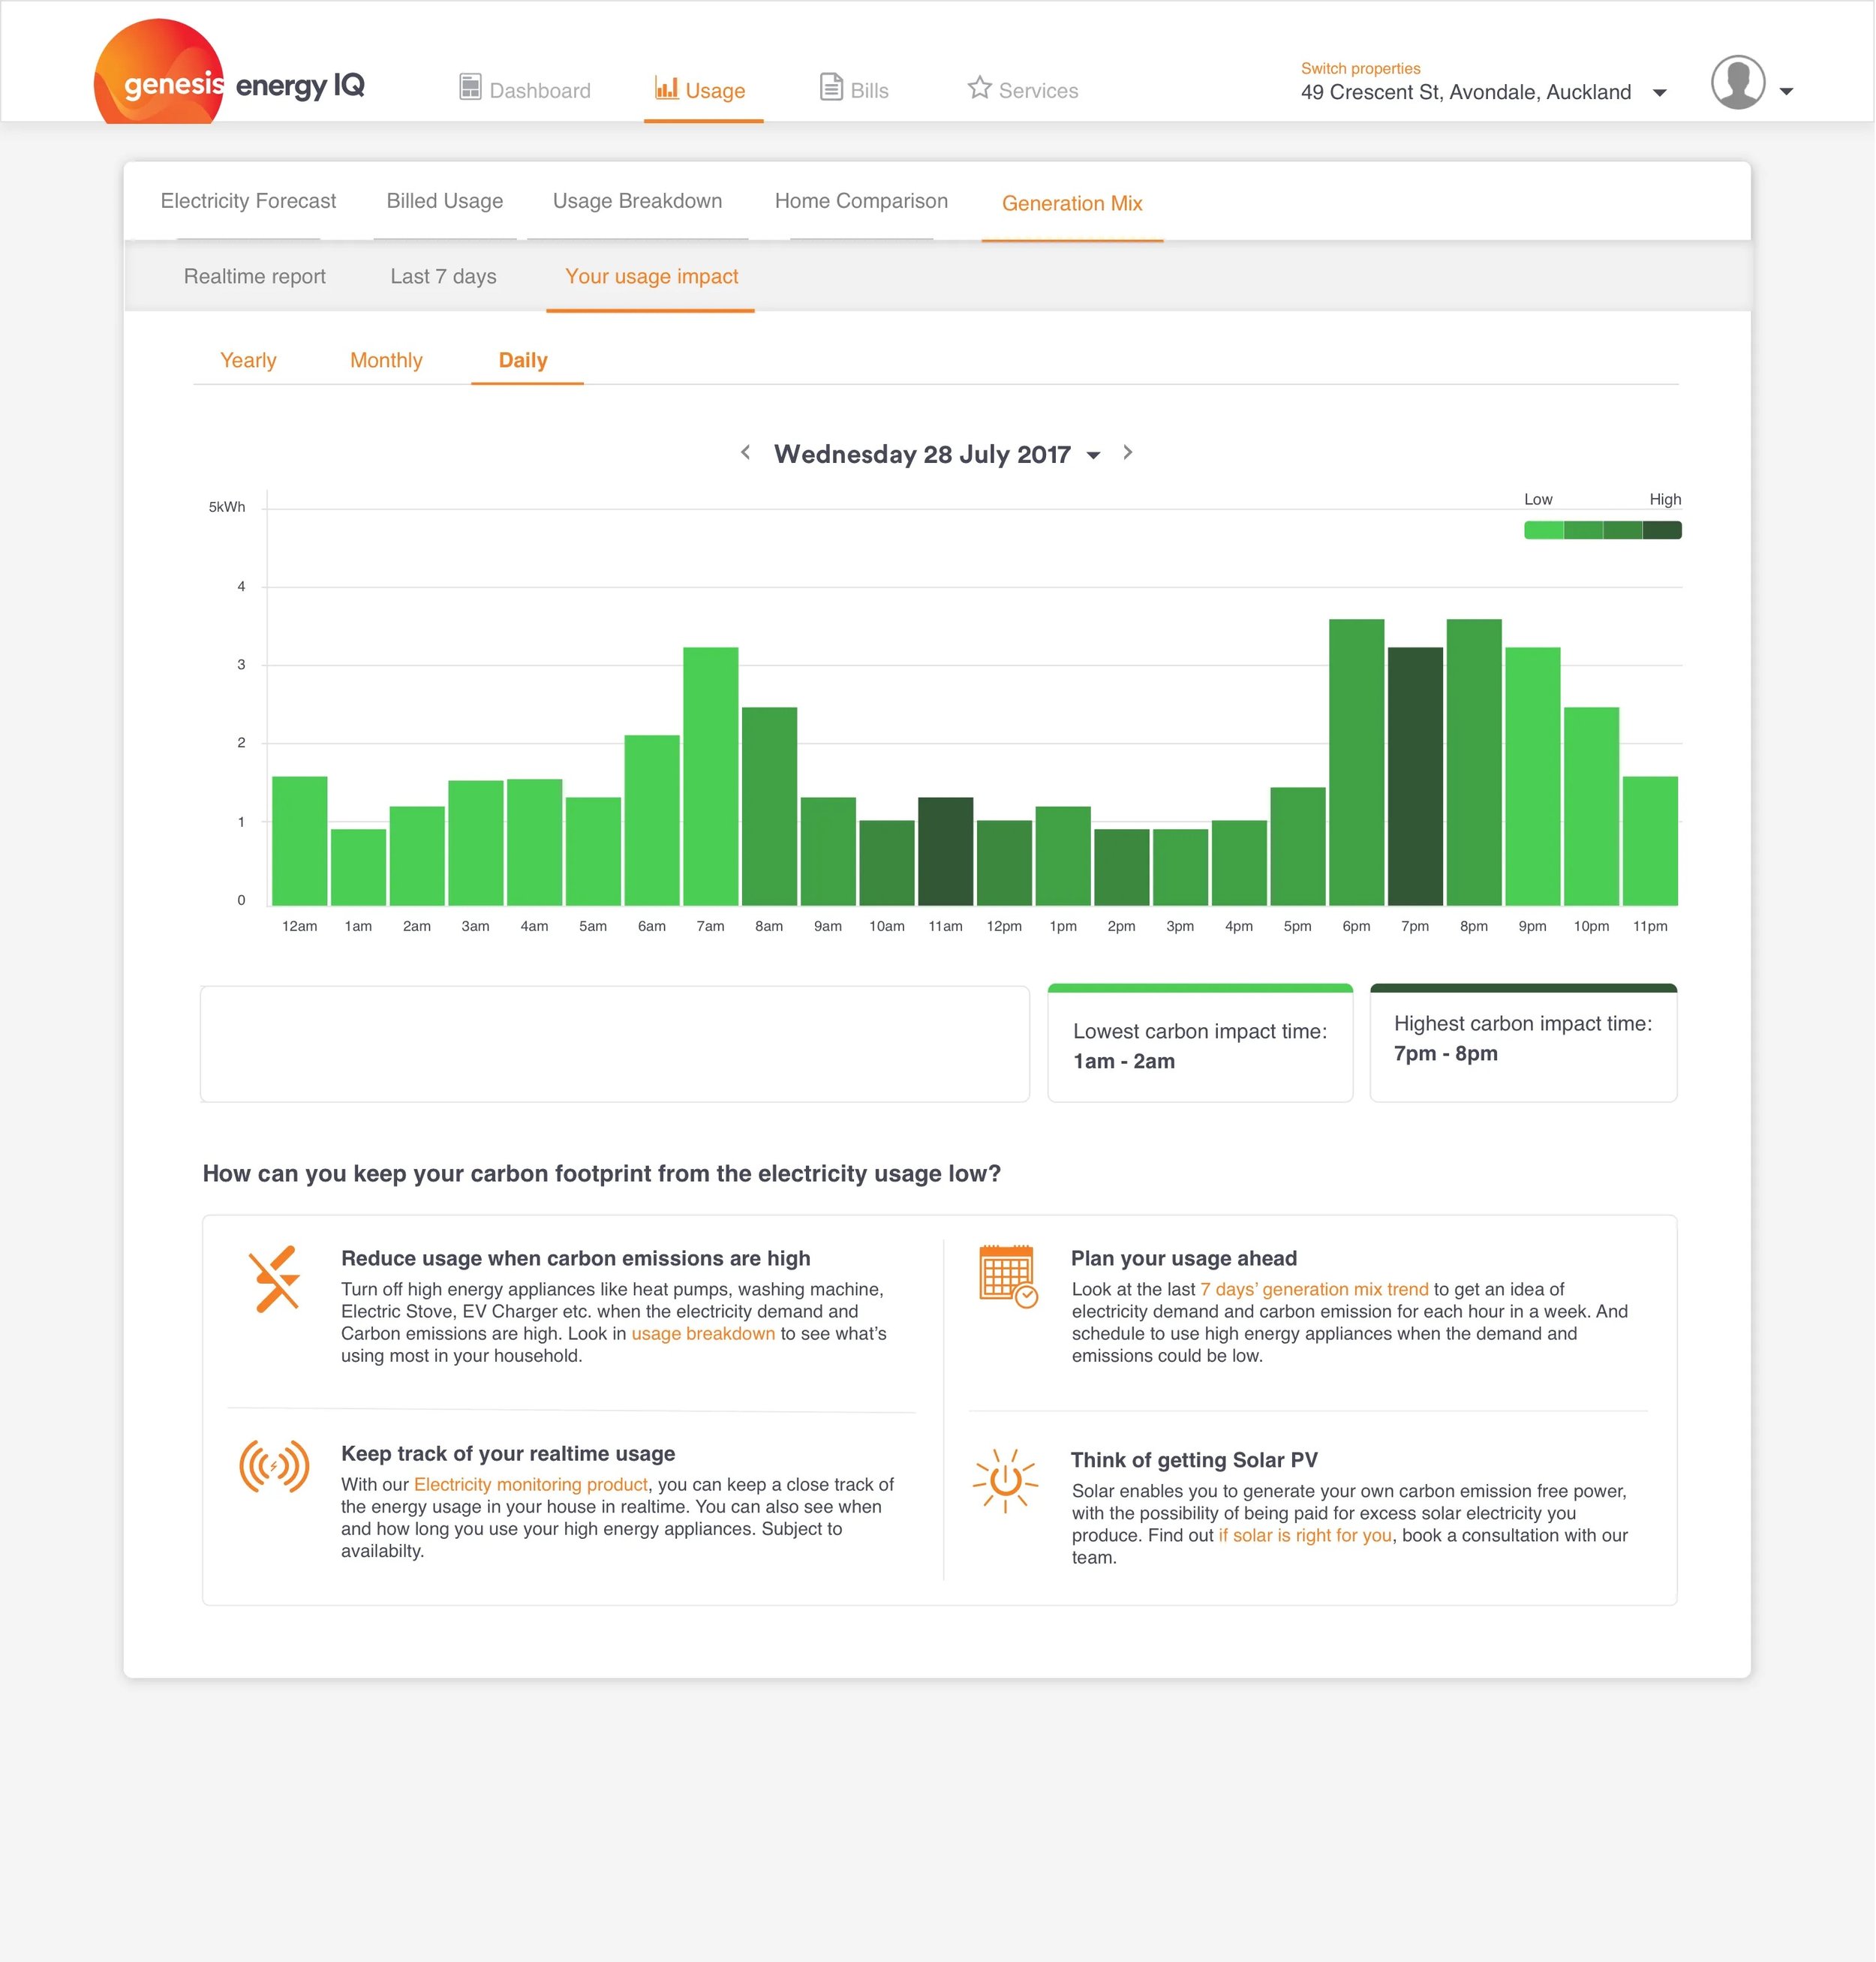
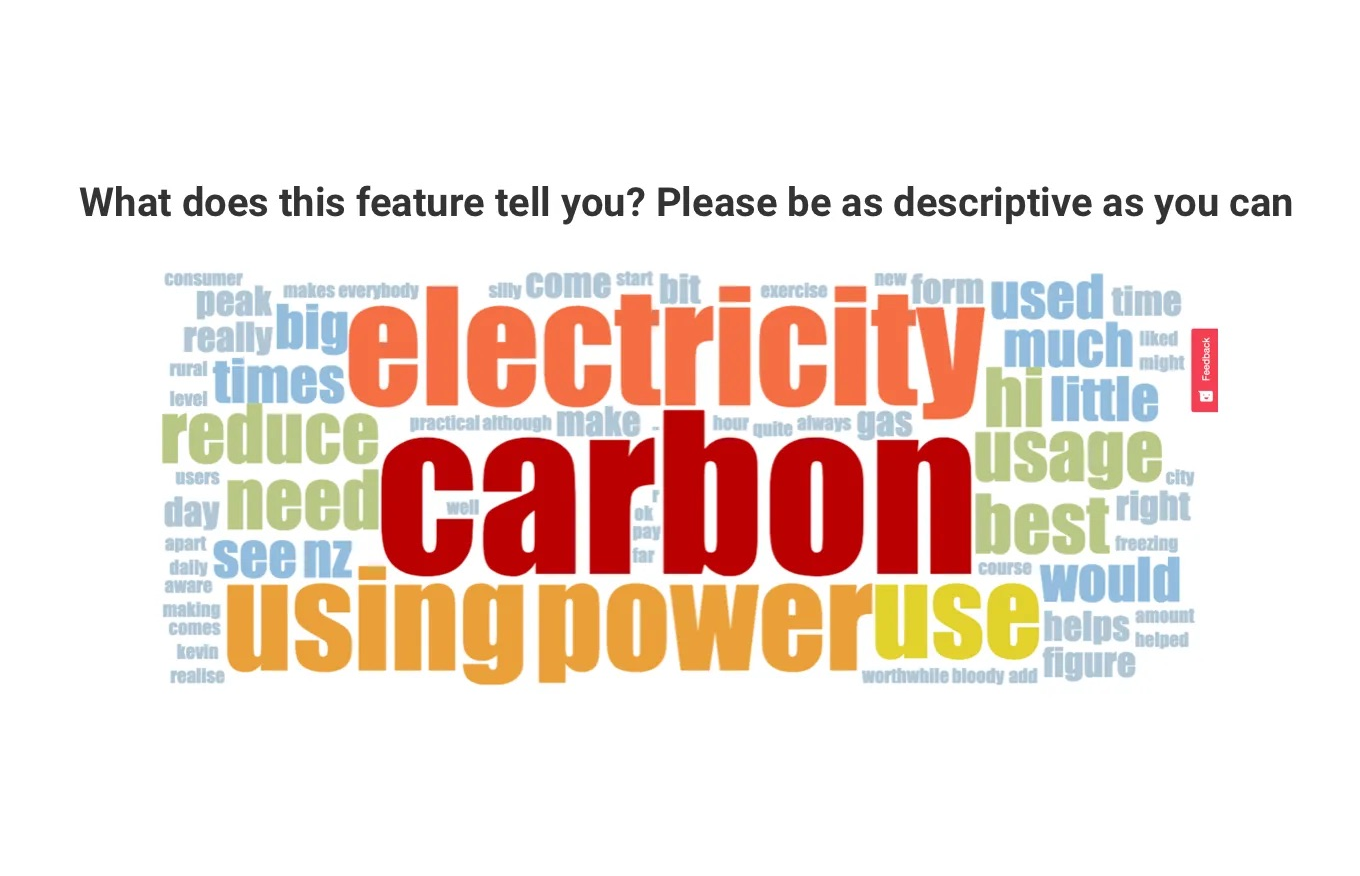
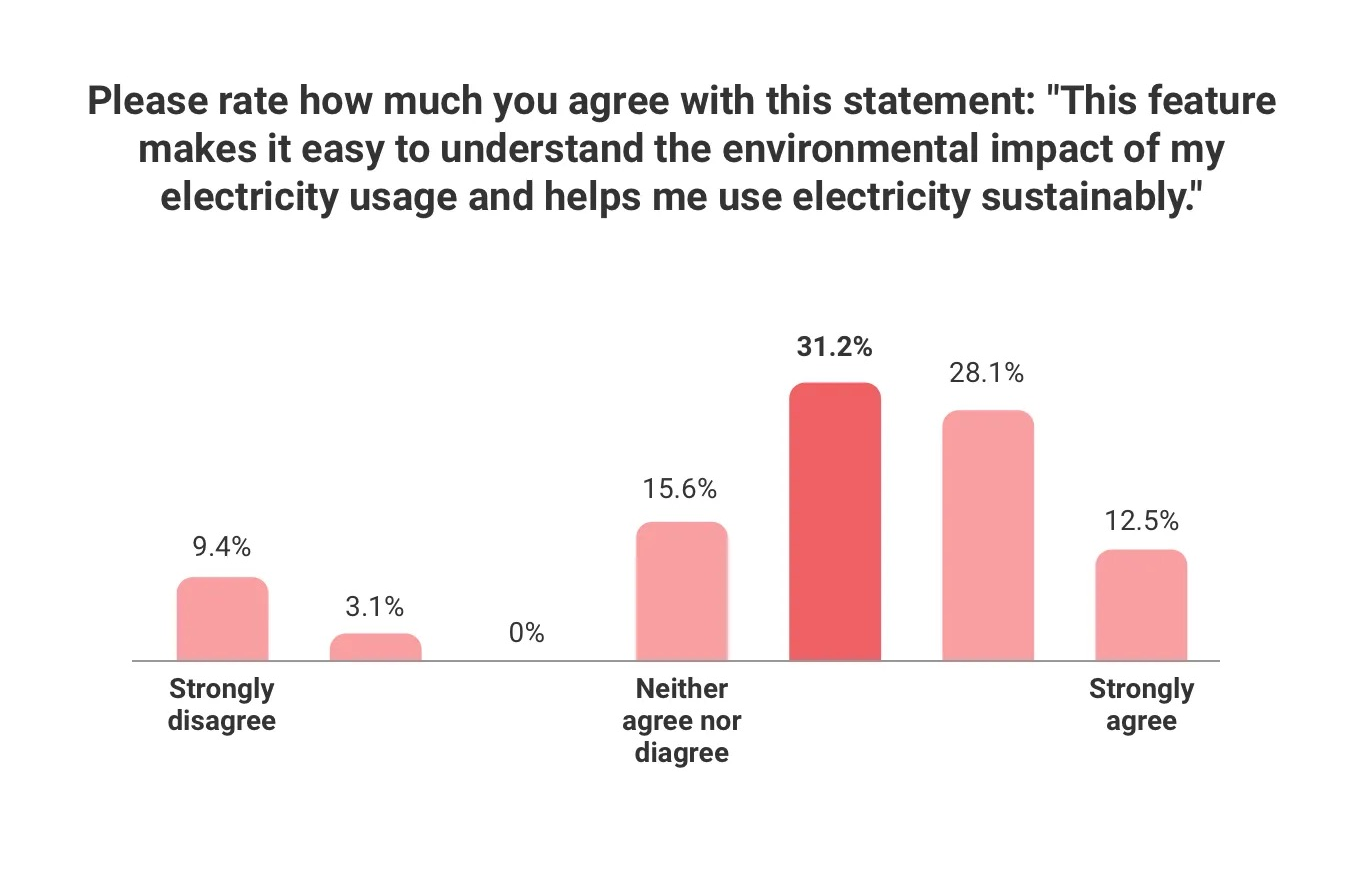
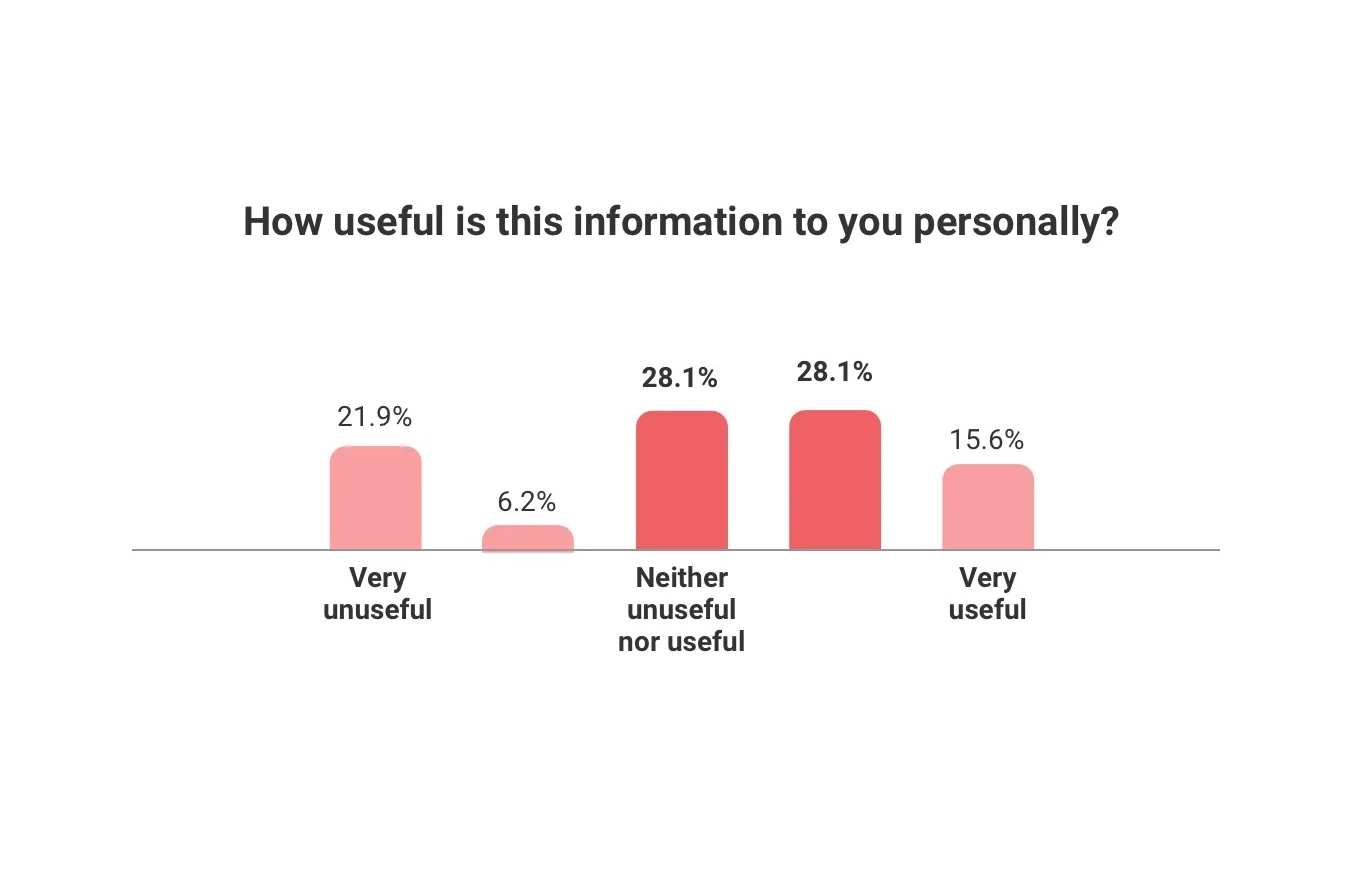
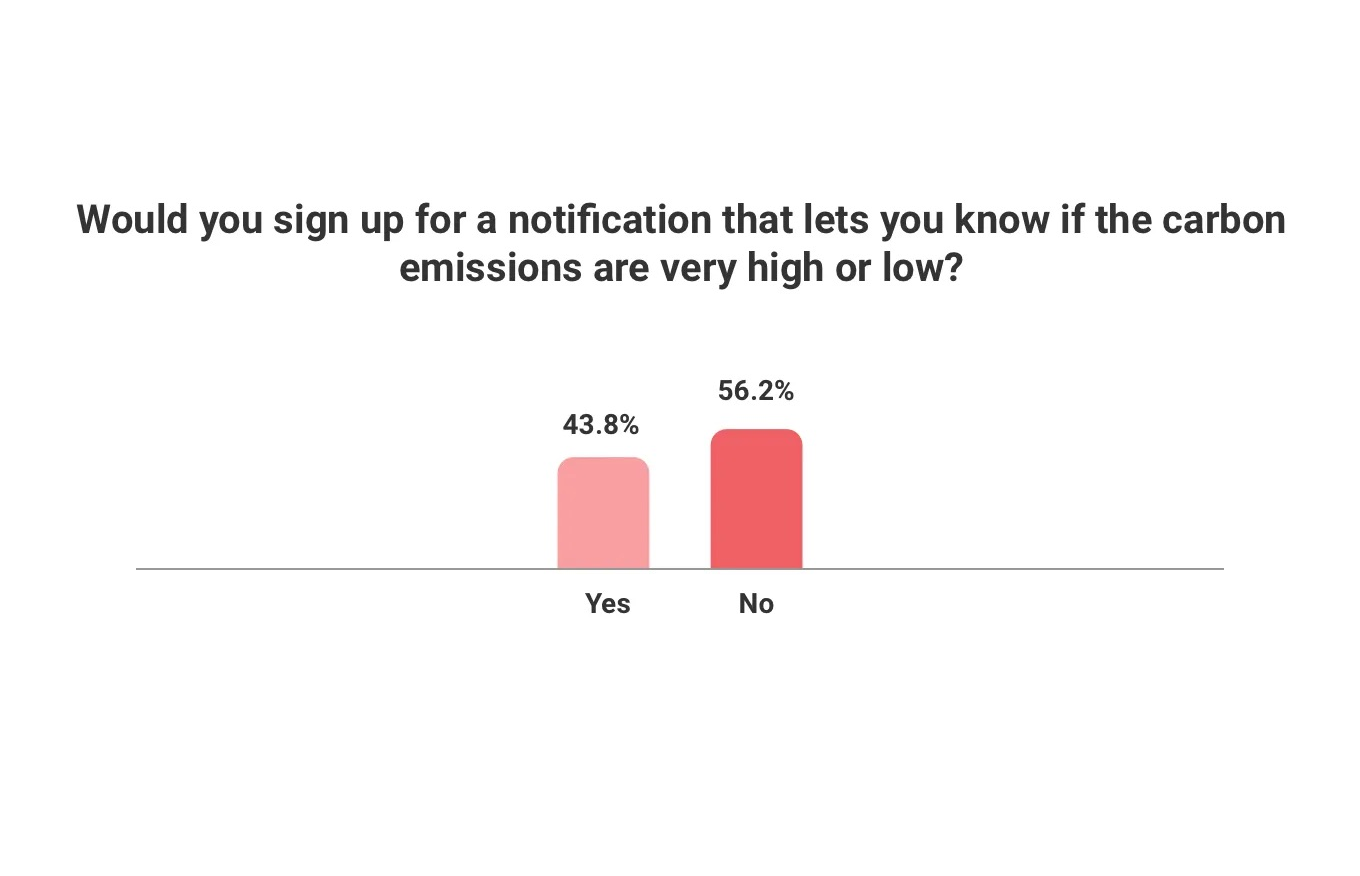
And then we got the feedback from the users through hotjar, which popped up questions on the page itself.
Outcomes
When we launched this feature, it garnered significant attention from the energy industry, both locally and internationally. It was even featured on national TV and radio, sparking conversations about carbon emissions and sustainability. Genesis was widely praised for its transparency and commitment to its sustainability goals.
On the customer side, the response was mixed:
Many users were intrigued but unsure how to use the information.
A small group engaged with it regularly, while the majority said they needed time to make sense of it.
Traffic to the feature was lower than expected, but it clearly resonated with a niche audience.
We knew there was potential to make this more impactful, so we went back to the drawing board. Talking to users, we uncovered what wasn’t working and brainstormed ways to improve.
The journey to refine this feature is covered in part two.
